← All projects

SQL · Python · Statistics · Tableau

Olist e-commerce analytics

A SQL and Python analysis of 96,000 real orders from a Brazilian online marketplace: why customers leave bad reviews, where delivery breaks down, and why 97% of customers never come back. Real, public data, so every number can be reproduced.

Tableau dashboards

I extended the original SQL and Python analysis with three Tableau dashboards, moving from an executive summary to delivery-problem diagnosis and recommended next steps.

1. Executive Overview

Summarizes total orders, GMV, late-delivery rate, average review score and low-review rate, with monthly, state-level and seller-level delivery views.
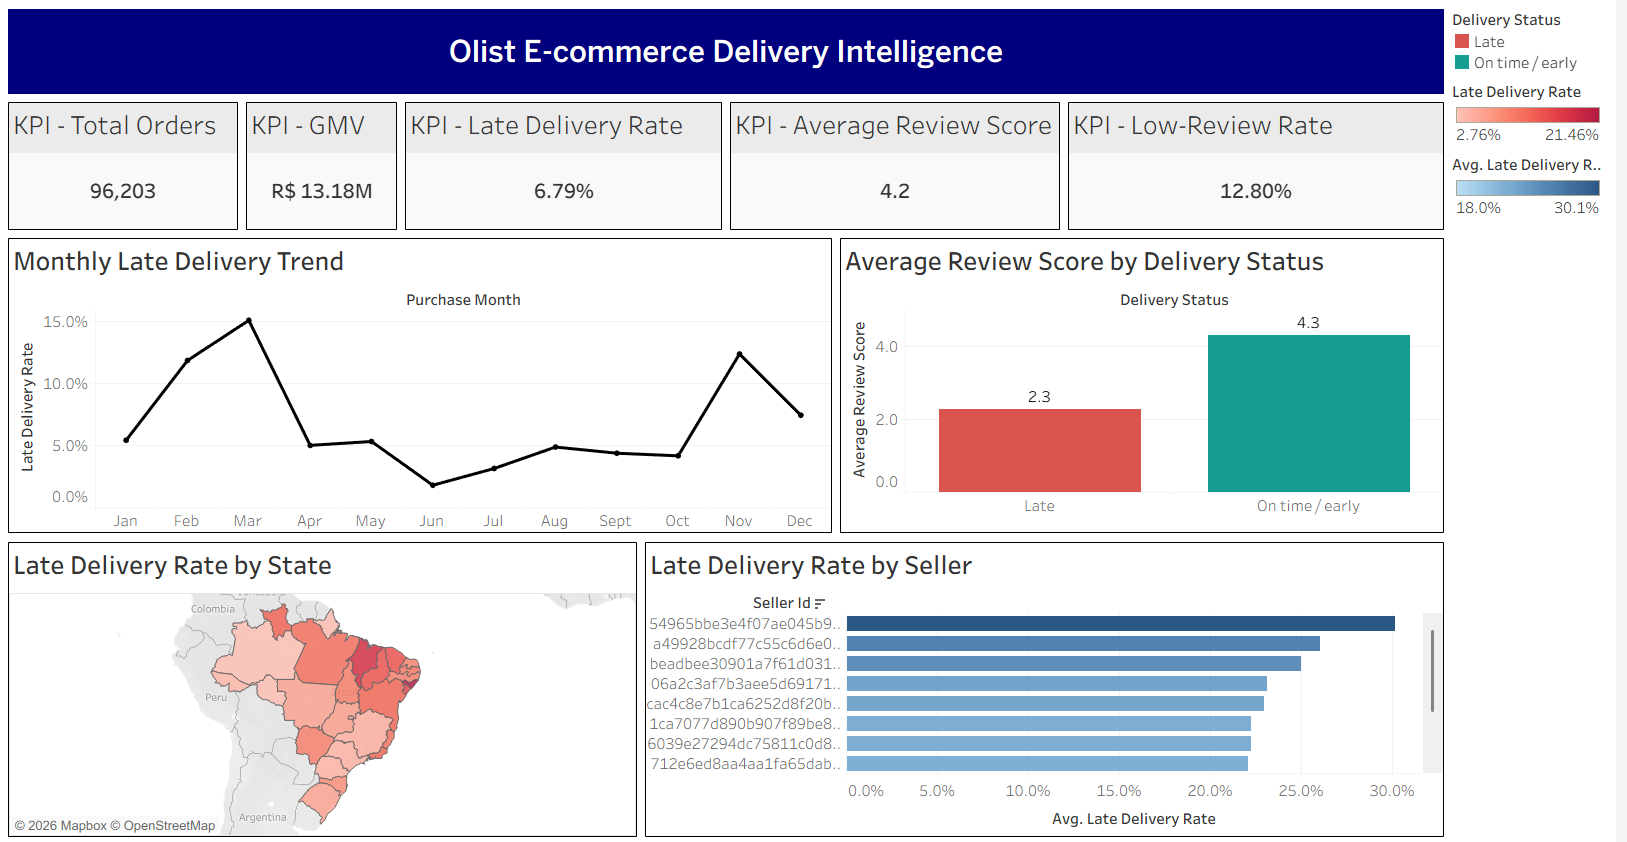
Tableau Executive Overview dashboard showing delivery KPIs, monthly trend, review scores, state map and seller performance

2. Delivery Problem Diagnosis

Compares late-order delay severity and review scores, and examines state-level late-delivery rates alongside late-order volumes.
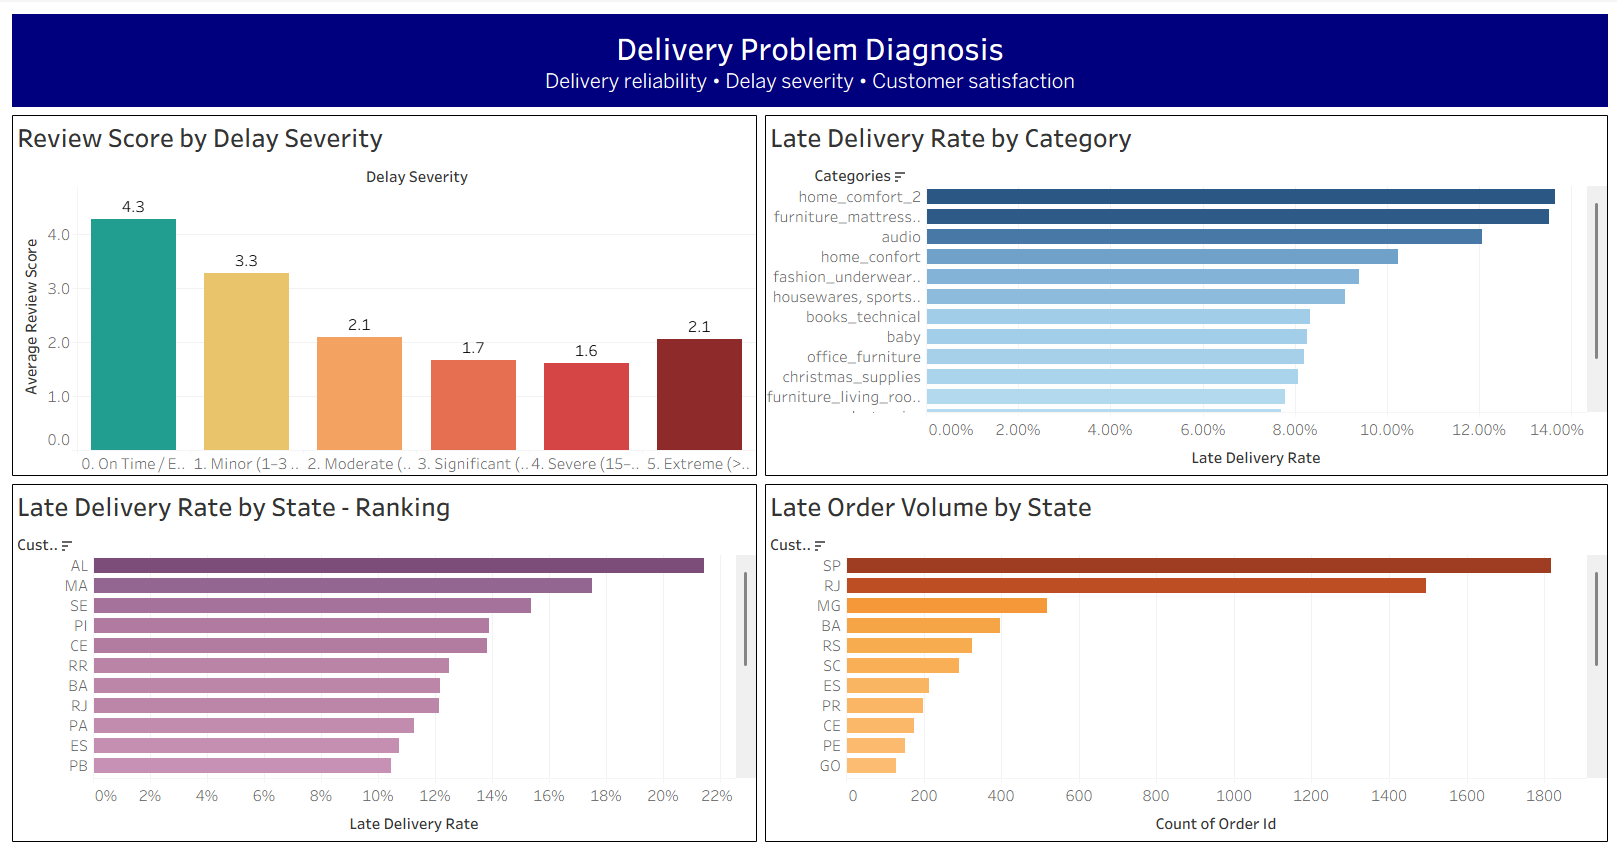
Tableau Delivery Problem Diagnosis dashboard showing delay severity, review scores, state delivery rates and late-order volume

3. Delivery Improvement Action Plan

Summarizes the key delivery metrics and translates the analysis into recommended investigations covering state-level bottlenecks, severe delays, category reliability and customer-satisfaction monitoring.
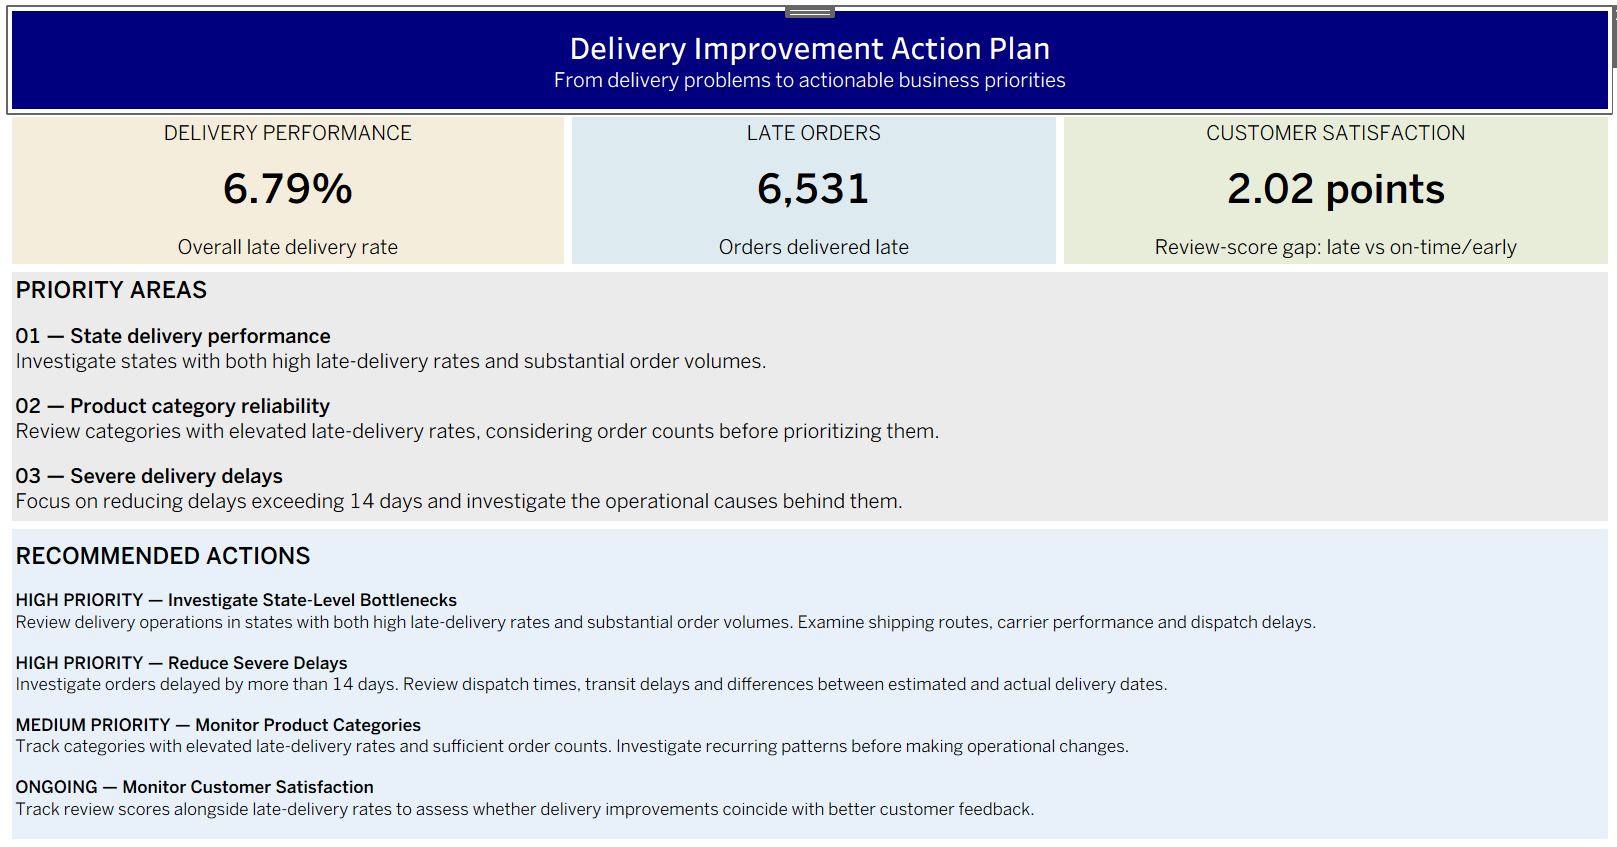
Tableau Delivery Improvement Action Plan dashboard with KPI cards, priority areas and recommendations

The dashboards are descriptive: they identify patterns and areas to investigate, rather than proving root causes or measuring the impact of implemented changes.
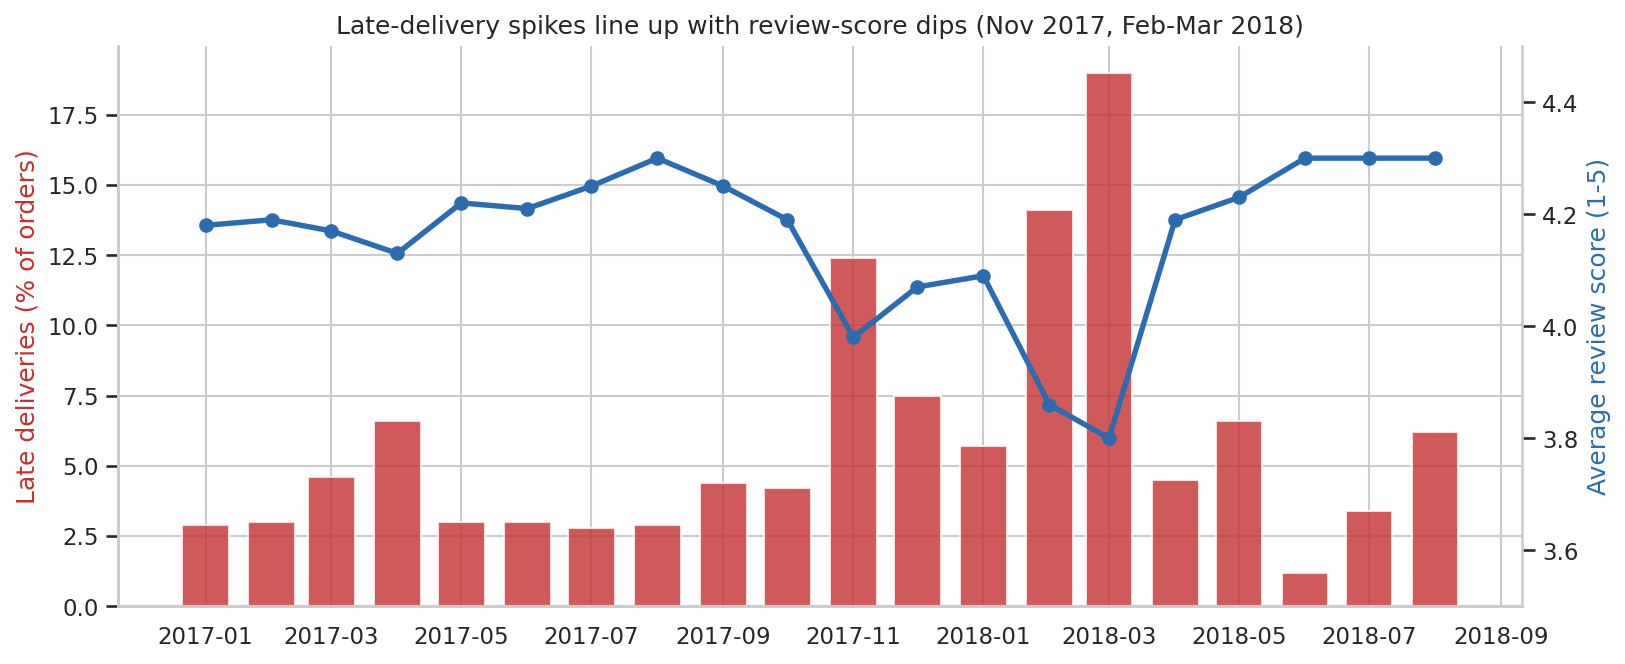
Monthly late-delivery rate as bars with average review score as a line; review score drops when late deliveries spike

Late-delivery spikes (Nov 2017, Feb–Mar 2018) line up with the dips in average review score.

Overview

My earlier SQL project used synthetic data, so I wanted one where nothing was generated. The Olist dataset is real, anonymised order data across nine related tables: orders, items, payments, reviews, customers, sellers and products. I audited it first, cleaned it in SQL views, then asked five questions: how did the business grow, where does delivery fail, does late delivery really hurt reviews, where does revenue concentrate, and who are the customers.

Key findings

2.26average review score for late orders (6,531), against 4.28 for on-time orders (89,672)
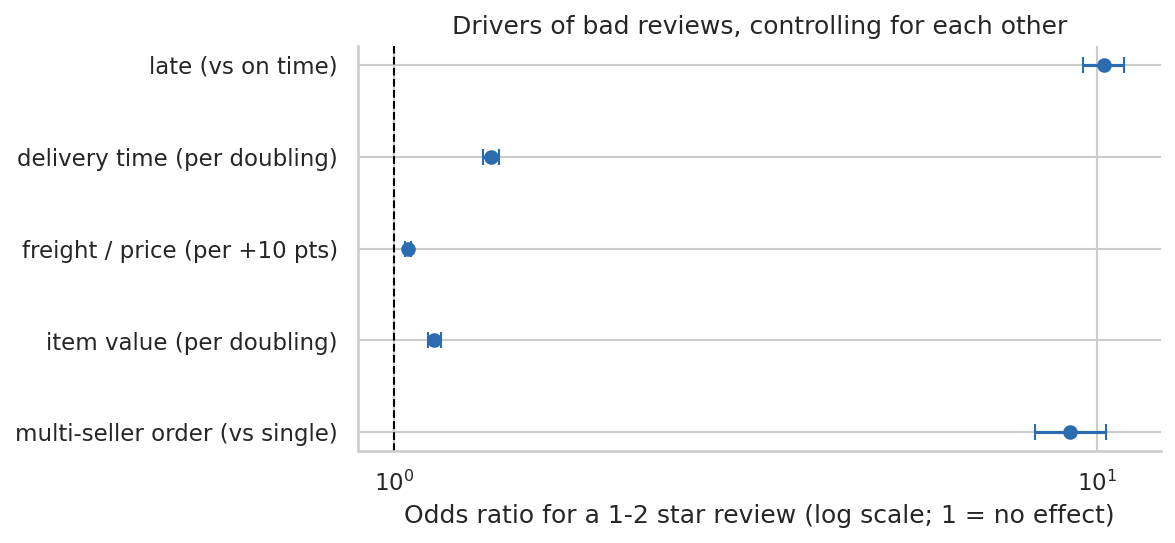
≈10×higher odds of a 1–2 star review for late orders, after controlling for delivery time, freight cost, item value and multi-seller orders
3.91average score for orders that took 21+ days but arrived on time, against 2.12 for those that were also late — the promise matters more than the wait
6.8%of orders arrived late overall, but 12.4% in Nov 2017 and 14–19% in Feb–Mar 2018
79%of orders arrive 7+ days before the promised date, so the delivery estimates are heavily padded
97%of customers ordered only once; returning customers stayed at about 2.5% of monthly revenue
67%of GMV comes from the top 10% of sellers
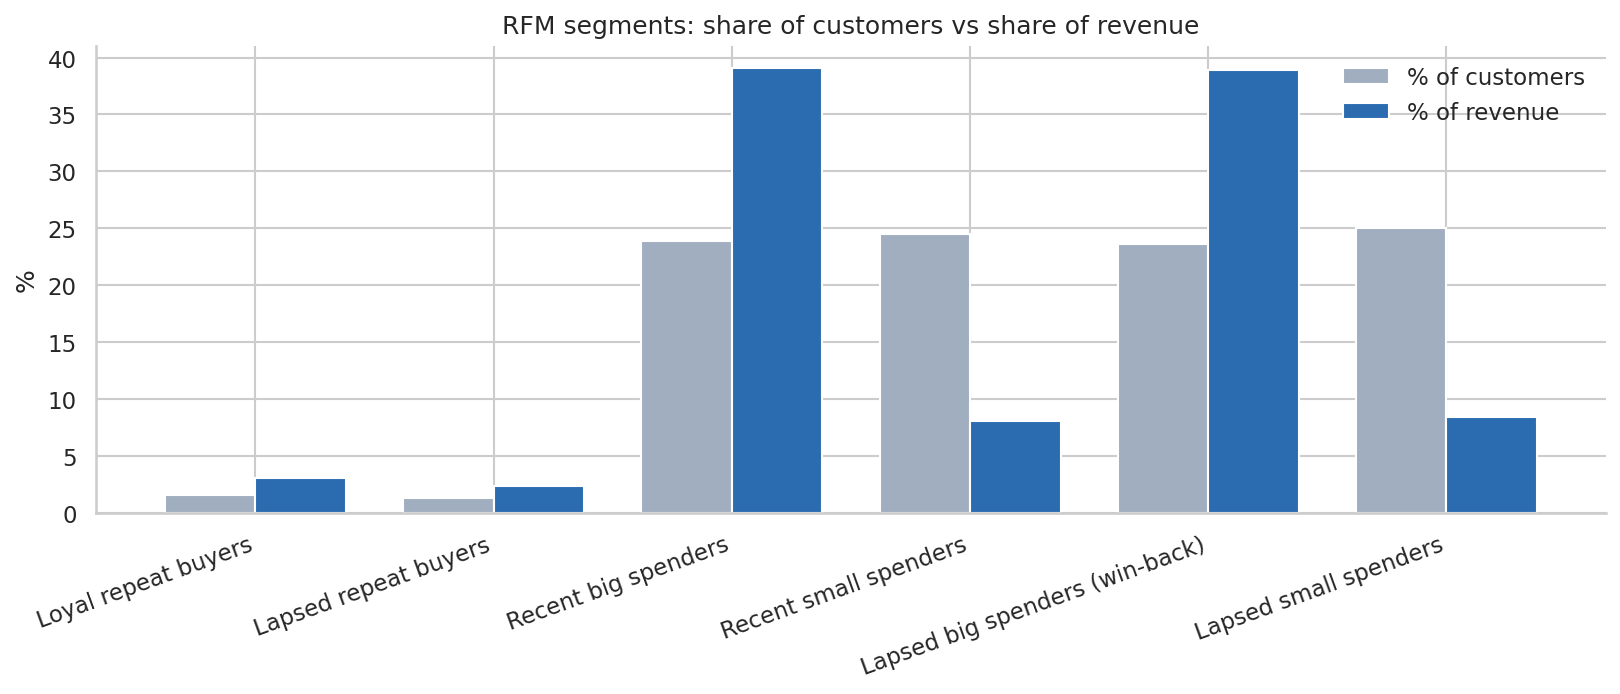
39%of revenue sits with 21,979 lapsed big spenders, the obvious win-back segment
8+ days early4.31
1–7 days early4.19
On the day4.01
1–3 days late3.28
4–7 days late2.09
8–14 days late1.67
15+ days late1.72

Average review score by delivery vs the promised date. The score does not fall gradually — it drops sharply the moment an order misses its date.

Odds ratios from a logistic regression predicting 1 to 2 star reviews

Logistic regression for a 1–2 star review. Late delivery has by far the largest effect; freight cost barely matters.

Recommendation

  • Manage the delivery promise, not just the speed. Plan capacity for November and the Feb–Mar window, and set more realistic estimates for the north-east, where 12–21% of orders arrive late even with 29–33 day promises.
  • Look at multi-seller orders. They are 1.3% of orders but average only 2.85 stars despite rarely being late. Split shipments are one plausible reason, but the data cannot confirm it.
  • Treat retention as the untapped lever. Growth flattened through 2018 while 97% of customers bought once. Test win-back offers on the lapsed big spenders.
  • Do not blame a few sellers. Among sellers with 50+ orders, the ones with 20%+ late rates cause only 1.5% of late orders. The problem is logistics and capacity.
Late delivery rate by customer state

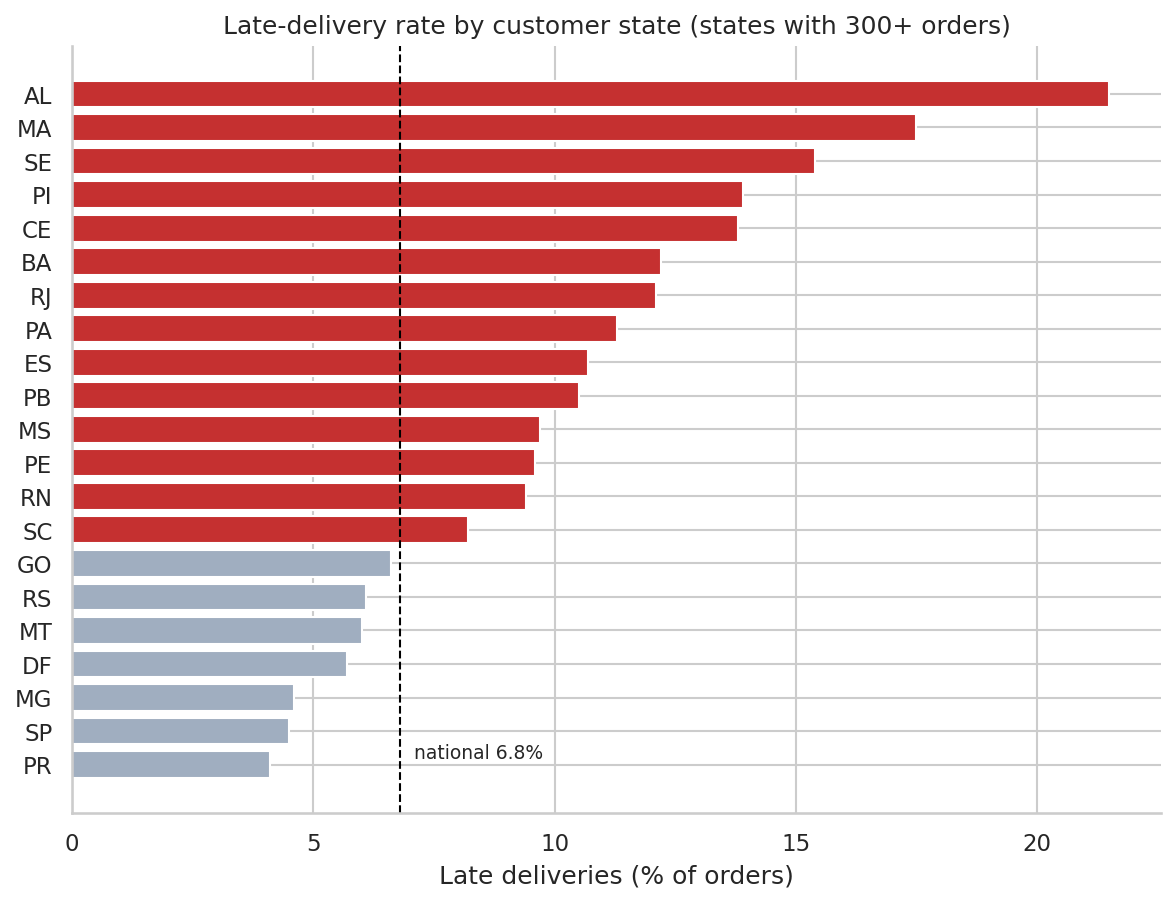
Late-delivery rate by customer state. North-east states such as Alagoas (21.5%) and Maranhão (17.5%) are far above São Paulo (4.5%).

How it's built

  • SQL: all nine tables loaded into a local DuckDB database using PostgreSQL-compatible SQL. One audit file, one cleaning-views file and five analysis files, using joins, CTEs, LAG(), RANK(), NTILE(), ROW_NUMBER(), running totals, moving averages and percentiles.
  • Data cleaning: customer_id is created per order, so I used customer_unique_id (99,441 ids vs 96,096 real customers); kept one review per order where 555 had several; excluded 166 orders with a carrier date before the purchase date; labelled 610 products with no category instead of dropping them.
  • Python: SQL results pulled into pandas, then a Mann-Whitney test, a chi-square test and a logistic regression (statsmodels), with charts in matplotlib and seaborn.
  • Reproducible: a build script checks every table against the official row count, and the headline numbers are written to a file by the notebook rather than typed by hand.
RFM customer segments showing share of customers vs share of revenue

RFM segments: share of customers against share of revenue.

Limits of the data

This is observational data, so the late-delivery effect is a strong association that survives controls, not proof of cause. Reviews are voluntary and unhappy customers write far more comments, so scores are not a random sample. GMV is item price, not Olist's own revenue. The data covers one marketplace in one country from 2016 to 2018, with no cost or marketing data. Because 97% of customers bought once, RFM recency mostly reflects when someone first ordered. A bad first review did not significantly reduce repeat purchases (4.6% vs 5.2%, p = 0.38), so I report that as a null result.

Source: Olist Brazilian E-Commerce Public Dataset on Kaggle.

What I'd add next

Text-mine the review comments, especially for late and multi-seller orders, to see what customers actually complain about. Then build a model that predicts which orders will be late from seller location, customer location and category, so the business could act before the promise is missed.